A useful way through
- Write the question the dashboard should answer and the decision it informs. For each number, record the exact metric name, platform, property or account, period and relevant filters. “Traffic” is not a sufficiently precise definition for a comparison.
- Keep ad clicks, analytics sessions, users and business outcomes in separate fields. Google explains that clicks and sessions measure different events and may differ for several reasons. Do not add them together as people or relabel server requests as customers.
- Check the reporting time zone, date boundaries, attribution settings and whether the displayed period is complete. Compare the same definitions and scopes. If a setting, data source or measurement method changed, annotate the comparison instead of treating every movement as an effect of the campaign.
- Keep the underlying lawful export or report reference and the interpretation beside the dashboard. If you lack the data, write “not measured”. State a plausible next investigation rather than inventing a cause, conversion rate or financial return from an isolated chart.
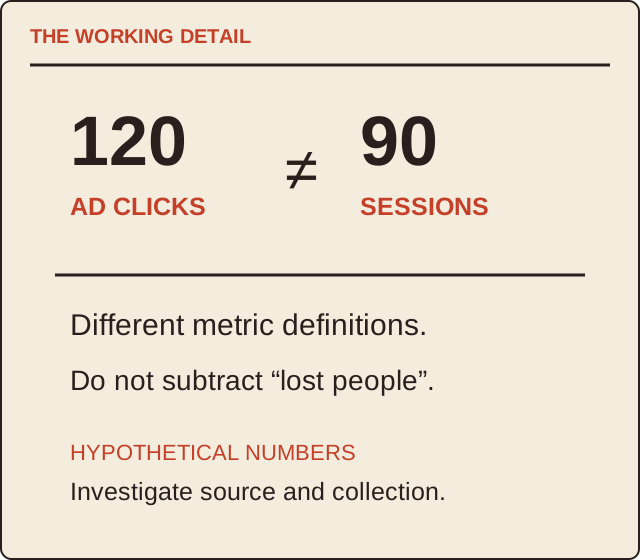
Read the map as text
THE WORKING DETAIL · 120 · AD CLICKS · 90 · SESSIONS · ≠ · Different metric definitions. · Do not subtract “lost people”. · HYPOTHETICAL NUMBERS · Investigate source and collection.
- Question
- Clicks
- Sessions
- Conclusion
Put it into practice
In a hypothetical report, an advertising platform shows 120 clicks while analytics shows 90 sessions for the selected period. The analyst records both definitions and investigates the discrepancy. They do not subtract 30 and call them lost customers. Neither number establishes sales, and without a comparable baseline no improvement is claimed.
Illustrative example, not a reported client project or test.
Your take-away checklist
Read a marketing dashboard without mixing unlike numbers
- □ Question: ____________________
- □ Clicks: ____________________
- □ Sessions: ____________________
- □ Conclusion: ____________________
Before you act
All figures here are hypothetical. No analytics is installed, account accessed or performance result claimed by this guide.
A worked record
Use the example to see the decisions, then download a blank record for your own task.
- Question
- Which channel needs investigation?Define the decision
- Clicks
- 120 in the exampleAdvertising metric
- Sessions
- 90 in the exampleDifferent analytics metric
- Conclusion
- Investigate definitions and collectionNo invented customer count
A metric dictionary you can reuse
Use name, definition, unit, source, scope, time zone, date range, filters and limitation. Keep the dictionary accessible to the people reading the report. If two teams mean different things by “conversion”, resolve the definitions before displaying a combined total.
What a chart cannot settle alone
A rising line does not isolate a cause. Changes in campaigns, audience, tracking, attribution or period completeness may matter. Retain the evidence for any claimed explanation and separate an observed association from a demonstrated effect.
Sources & context
The earlier topic was published 2022-09-19 under the Maria Baldwin byline. The present procedure, examples and diagrams are new work by MichaelT editorial; they do not attribute a new test or professional assessment to the earlier author.
Source information checked 17 October 2026; use the actual current requirements for your situation.