Identify what is actually measured
Record the sensor identifier, location context, pollutant or quantity, unit and time zone. Keep these fields with the exported data. A number labelled air quality may be a concentration, an index or a vendor score; they are not interchangeable. Ask for the definition if the display omits it. Avoid publishing a precise private location when a general monitoring context is sufficient.
State the time basis
Distinguish individual readings from an average and record the period represented by each point. Do not compare a short spike with a daily statistic as though they describe identical intervals. Preserve timestamps and note any known clock or unit change. The EPA’s sensor guide discusses data quality and interpretation; a visually smooth line is not evidence that the underlying measurements are accurate.
Count missing observations
Record how many readings were expected and how many are usable for the stated interval. Mark missing data rather than filling it with zero. When illustrating a simple arithmetic mean, show the included values and the denominator. A completeness percentage describes the supplied data count, not a universal regulatory validity threshold. Follow the actual study or authority’s method for a real monitoring purpose.
Keep conclusions within the evidence
Ask about calibration, collocation, environmental effects and the intended use before drawing comparisons. Low-cost sensor output alone does not establish regulatory compliance or a personal medical conclusion. Keep changes in location, instrument and averaging visible so a comparison is not attributed entirely to a change in air. Preserve raw data and document any later transformation separately.
Read the drawing as text
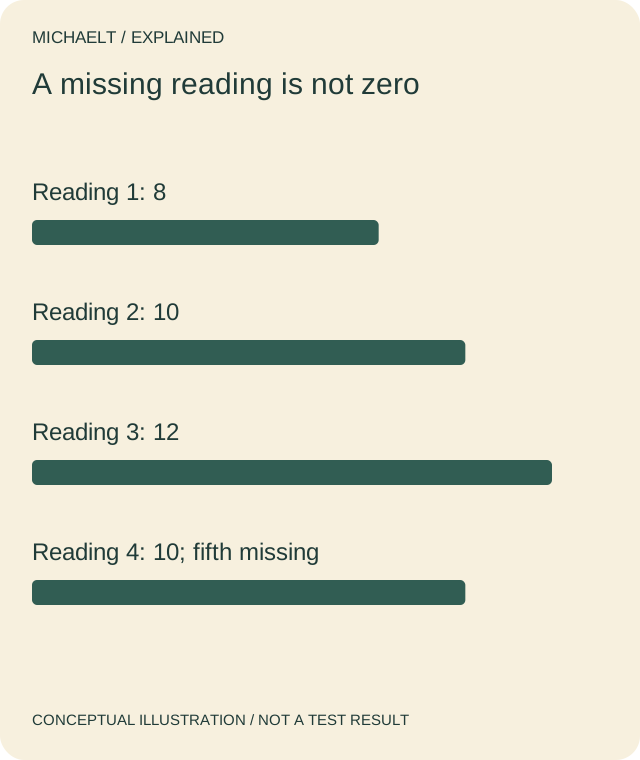
Four fictional readings total 40, mean 10. Completeness is 4 of 5, or 80%; the missing observation is not assigned zero.
Work through an example
A fictional interval expects five readings. Four usable values, all in the same stated unit, are 8, 10, 12 and 10; one reading is missing. Their arithmetic mean is 40 / 4 = 10, with 4 / 5 = 80% completeness. Entering zero for the missing observation would give 8 and misdescribe the supplied data. No pollutant threshold or health judgement is assigned.
Illustrative example; figures, people and organisations in the worked record are fictional.
The example record
Values
- Illustrative record
- 8; 10; 12; 10
- Interpretation
- Same unit and interval
Missing
- Illustrative record
- 1 of 5 expected
- Interpretation
- Not zero
Mean
- Illustrative record
- 40 / 4 = 10
- Interpretation
- Four included observations
Completeness
- Illustrative record
- 4 / 5 = 80%
- Interpretation
- Not a compliance threshold
Download blank worksheet (.csv) ↗Download worked example (.csv) ↗
Keep your own record
Use the result within its scope
This is an interpretation exercise with fictional numbers. It does not calibrate a sensor, calculate an official air-quality index or establish that a place is safe to breathe.
Reference sources
Earlier articles on this subject
- What are Smart Poles? ↗ — 2022-01-08, Maria Baldwin.