Identify the edition and series
Record the publisher, dataset edition, geographic coverage and series name. The United Nations World Population Prospects 2024 dataset is a named primary source with its own definitions and release context. A chart copied into a later article does not become a new dataset simply because the article’s date changes. Keep the original publication and reference periods separate.
Distinguish estimates and projections
Ask which values describe estimated past or present conditions and which depend on assumptions about a future period. Keep the projection horizon and scenario with the number. A future value is not an observation already made. Do not merge two editions or scenarios into one line without disclosing the change; apparent differences may reflect revised assumptions or data rather than a measured event.
Show arithmetic without adding causation
For a limited reading exercise, calculate a stated change using the same units and baseline. Label all fictional numbers clearly. A percentage change does not identify its cause, establish the impact of a specific policy or tell an individual what family decisions to make. Follow the source’s explanation of assumptions and uncertainty rather than attaching a political or health recommendation to a graph.
Report the claim at the right strength
Write a sentence that includes the edition, scenario and horizon, then state what the source does and does not support. Keep demographic descriptions separate from individual choices and rights. If a copied chart lacks its series or assumptions, trace the source before repeating it. A clear chart caption is more useful than replacing the missing context with a confident prediction.
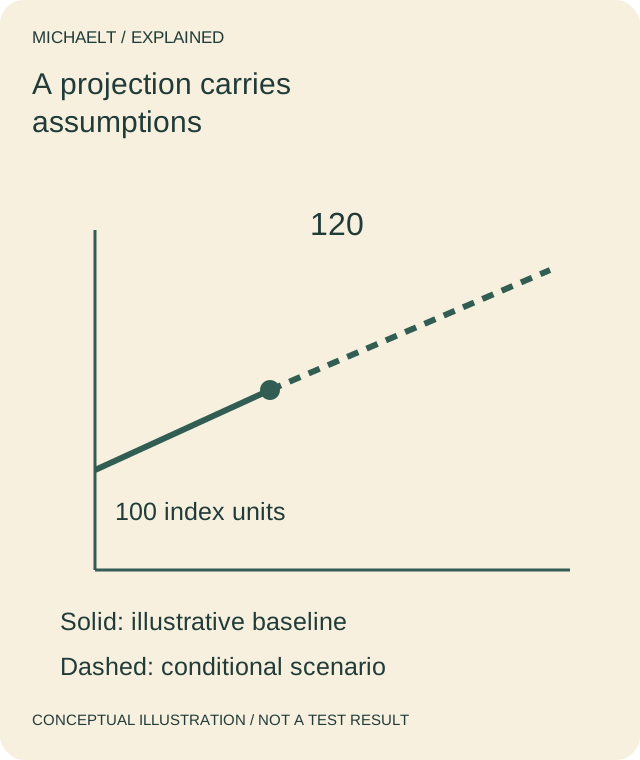
Read the drawing as text
The fictional index rises from 100 to 120, a 20% change. The later value is a scenario, not an observation.
Work through an example
A fictional scenario starts at 100 index units and projects 120 at a later horizon. The arithmetic change is 20 units, or 20% of the stated baseline. Those are invented index values, not UN population estimates. A different scenario might yield a different result. The example supports a reading method, not a population forecast or advice about reproduction.
Illustrative example; figures, people and organisations in the worked record are fictional.
The example record
Edition
- Evidence
- Named dataset release
- Next question
- Not the article date
Series
- Evidence
- Defined estimate or scenario
- Next question
- Do not merge silently
Illustration
- Evidence
- 100 → 120 index units
- Next question
- 20% change from baseline
Conclusion
- Evidence
- Projection under assumptions
- Next question
- Not an observed future
Download blank worksheet (.csv) ↗Download worked example (.csv) ↗
Keep your own record
Use the result within its scope
Use the source’s actual definitions and uncertainty. A projection can inform discussion while remaining conditional; it does not prove a policy effect, justify coercion or determine personal family choices.