Find the original study and date
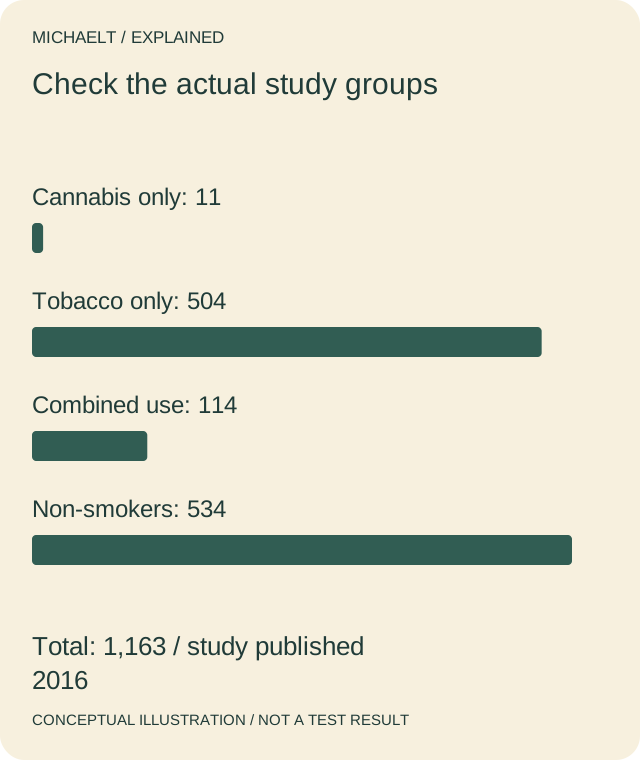
The 2016 paper by Reece, Norman and Hulse is an observational study from a single primary-care addiction clinic in Brisbane. Its abstract lists 11 cannabis-only participants, 504 tobacco-only, 114 using both and 534 non-smokers. The earlier MichaelT source incorrectly gave the mixed group as 144. Keep the paper’s real date and design; a 2026 editorial reading is not a new experiment.
Name the outcome precisely
The paper’s main outcome was algorithmically calculated vascular age. That is not a direct observation of every aspect of a person’s biological ageing. FDA’s endpoint explanation distinguishes a surrogate measure from how a person feels, functions or survives, and explains that predictive validity needs evidence in its context. A mechanism, laboratory marker or related study cannot silently replace the outcome actually investigated.
Keep the comparison and limitations
Ask how the groups were formed, what was adjusted for and what the authors identify as limitations. The paper itself flags the small cannabis-only group and variability in the biomarker. Observational adjustment is useful evidence but does not turn the design into a randomised experiment. Do not translate a group-level model estimate into a calculator that adds years to an individual reader’s age.
Practise with an explicitly invented comparison
For another reading exercise, suppose a fictional study reports 10 events among 100 people in A and 20 among 100 in B. The difference is 10 percentage points; A has half B’s event proportion. The outcome definition, uncertainty and design still matter. Those invented counts are not results from the 2016 paper, a treatment recommendation or evidence about any particular medicine or behaviour.
Read the drawing as text
The 2016 observational study lists 11 cannabis-only, 504 tobacco-only, 114 combined-use and 534 non-smoking participants: 1,163 total. The earlier source gave 144 instead of 114 for the combined group. This is not the separate invented event-rate example.
Work through an example
A reader first corrects the historical group count to 114, then labels the real paper’s outcome as calculated vascular age. Separately, the fictional A/B exercise gives 10/100 versus 20/100: 10% versus 20%, a 10-point difference and 50% lower proportion relative to B. Neither exercise supplies an individual prognosis or demonstrates that an intervention caused the difference.
Illustrative example; figures, people and organisations in the worked record are fictional.
The example record
Original count
- Illustrative evidence
- Mixed group: 114
- Meaning or next step
- Not the earlier 144
Actual outcome
- Illustrative evidence
- Calculated vascular age
- Meaning or next step
- Retain the study’s scope
Invented proportions
- Illustrative evidence
- 10% versus 20%
- Meaning or next step
- 10 percentage points apart
Relative comparison
- Illustrative evidence
- 10 / 20 = 0.5
- Meaning or next step
- Not a causal or personal prediction
Download blank worksheet (.csv) ↗Download worked example (.csv) ↗
Keep your own record
Use the result within its scope
A careful reading can correct a factual error while retaining uncertainty about interpretation. Take clinical implications to an appropriately qualified professional; this page neither endorses substance use nor supplies treatment or prognostic advice.
Reference sources
- Reece, Norman and Hulse: observational vascular-age study, 7 November 2016 ↗
- FDA: surrogate endpoints and clinical outcomes ↗
Earlier articles on this subject
- Cannabis Use Is Associated With Faster Aging ↗ — 2021-06-29, Maria Baldwin.
- Treating Infertility With Acupuncture ↗ — 2021-03-13, Maria Baldwin.
- Acupuncture Therapy Helpful With Improving Health Conditions ↗ — 2022-07-25, Maria Baldwin.